Platform credits
Using the Api-Verse API to request data requires credits, you can see how many credits you currently own as well as a history of used and gained credits by navigating to the “Credits” tab under “Account”.
The credits page consists of three subpages: “Overview”, “Gained” and “Used”; you can access them by switching the tabs on top of the site.
Overview
In the overview section you can see an overview of your current credit balance and a general history of changes.
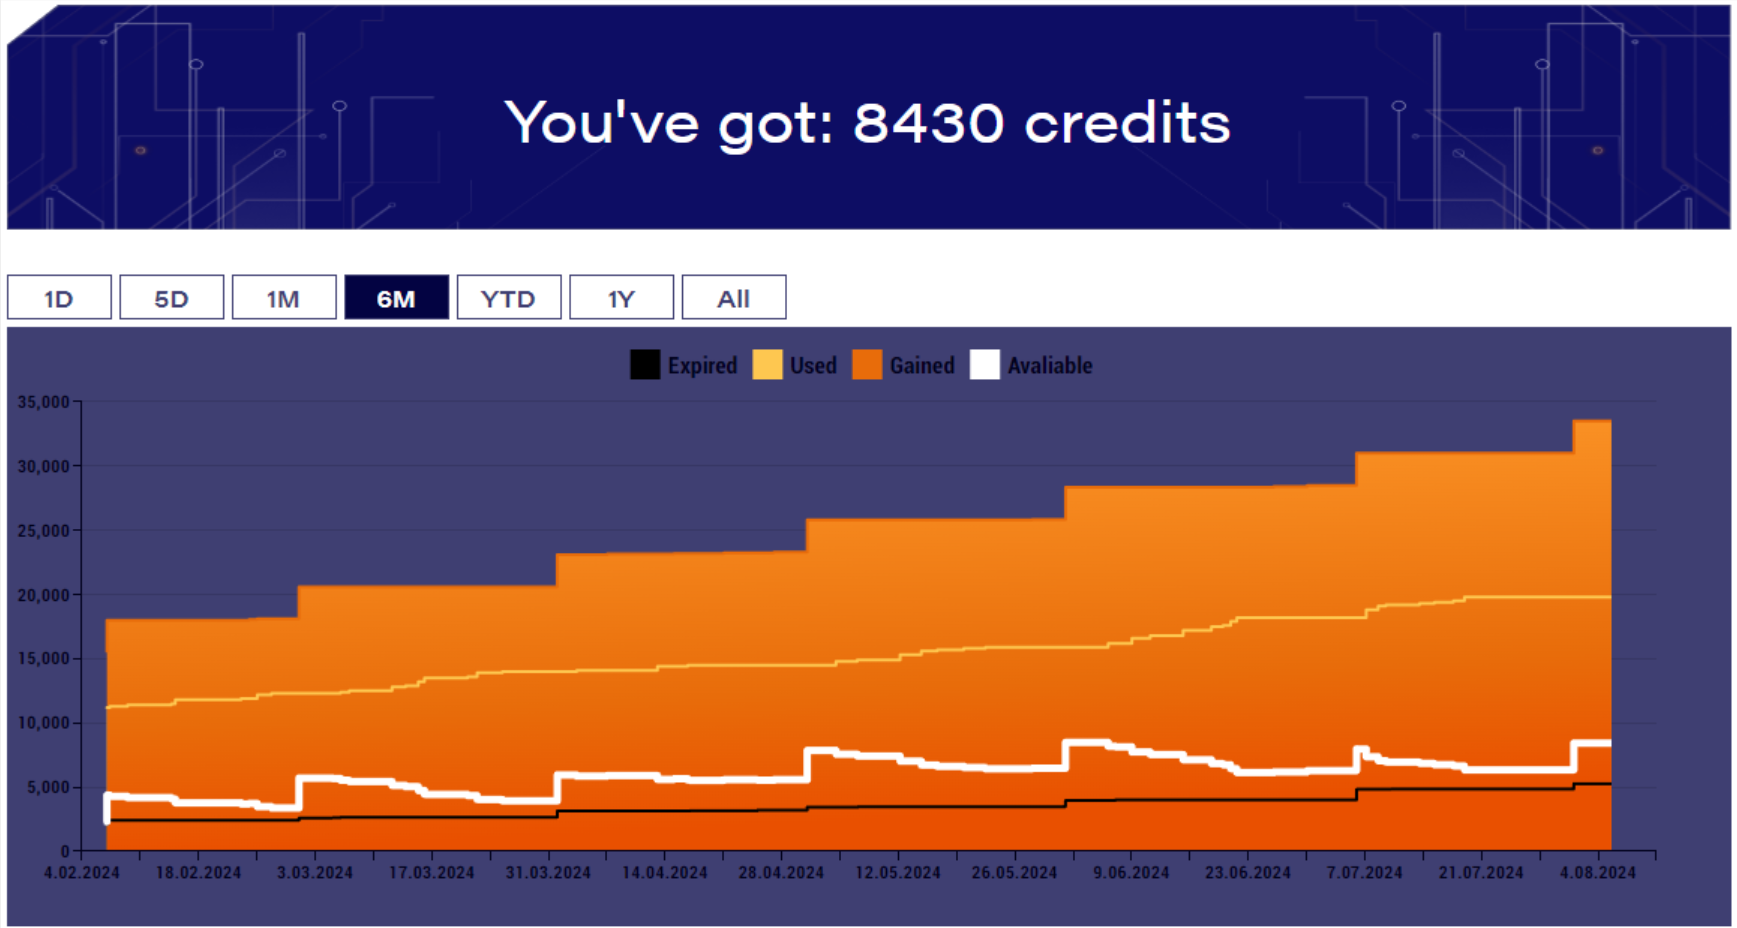
On top of the page you will see your current credit balance, right underneath the balance you can see a graph of changes to the credit balance over a selected period of time. You can see how many credits you gained each day, how many were used and how many expired as well as a total number of credits available for use.
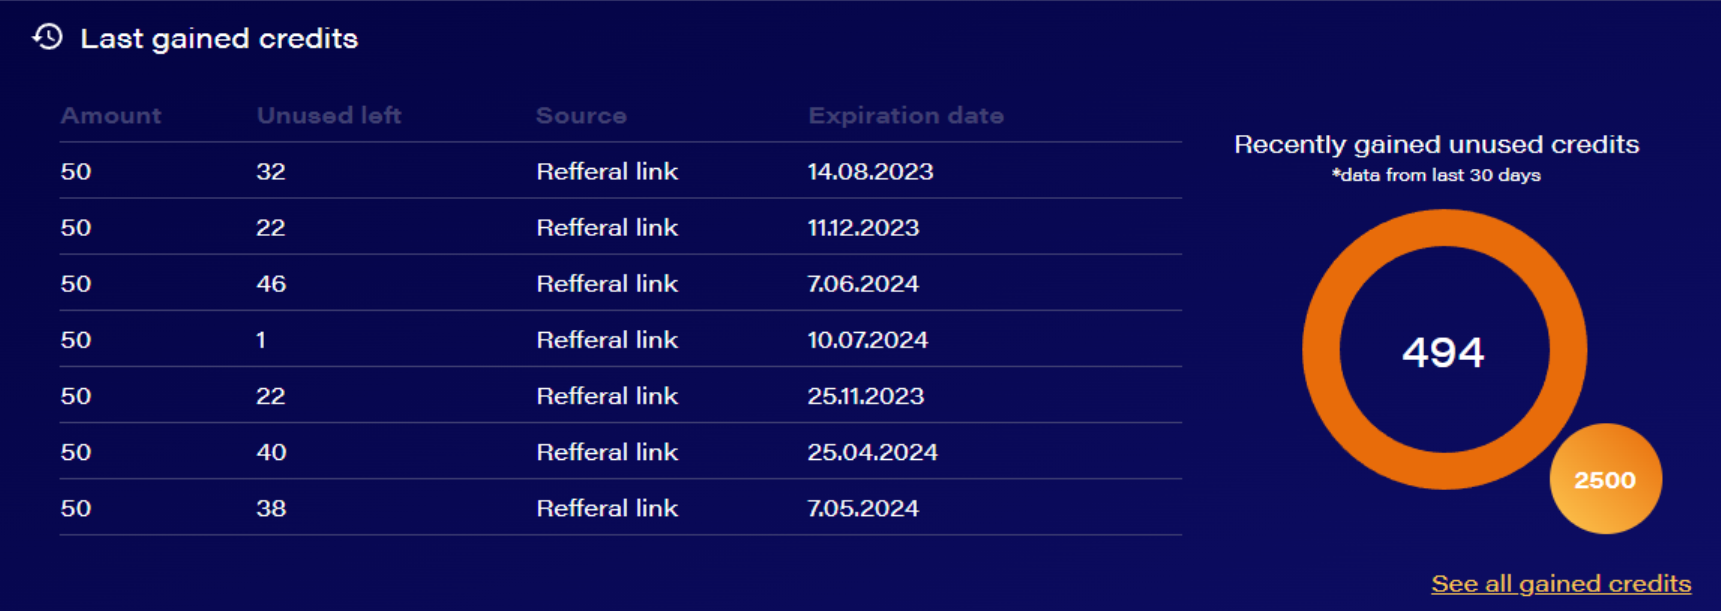
In the next section you can see the last credit addition to your account as well as a small summary of gained and unused credits from the last 30 days with information about their expiration date. You can click on “See all gained credits” to navigate to the tab dedicated to gained credits.
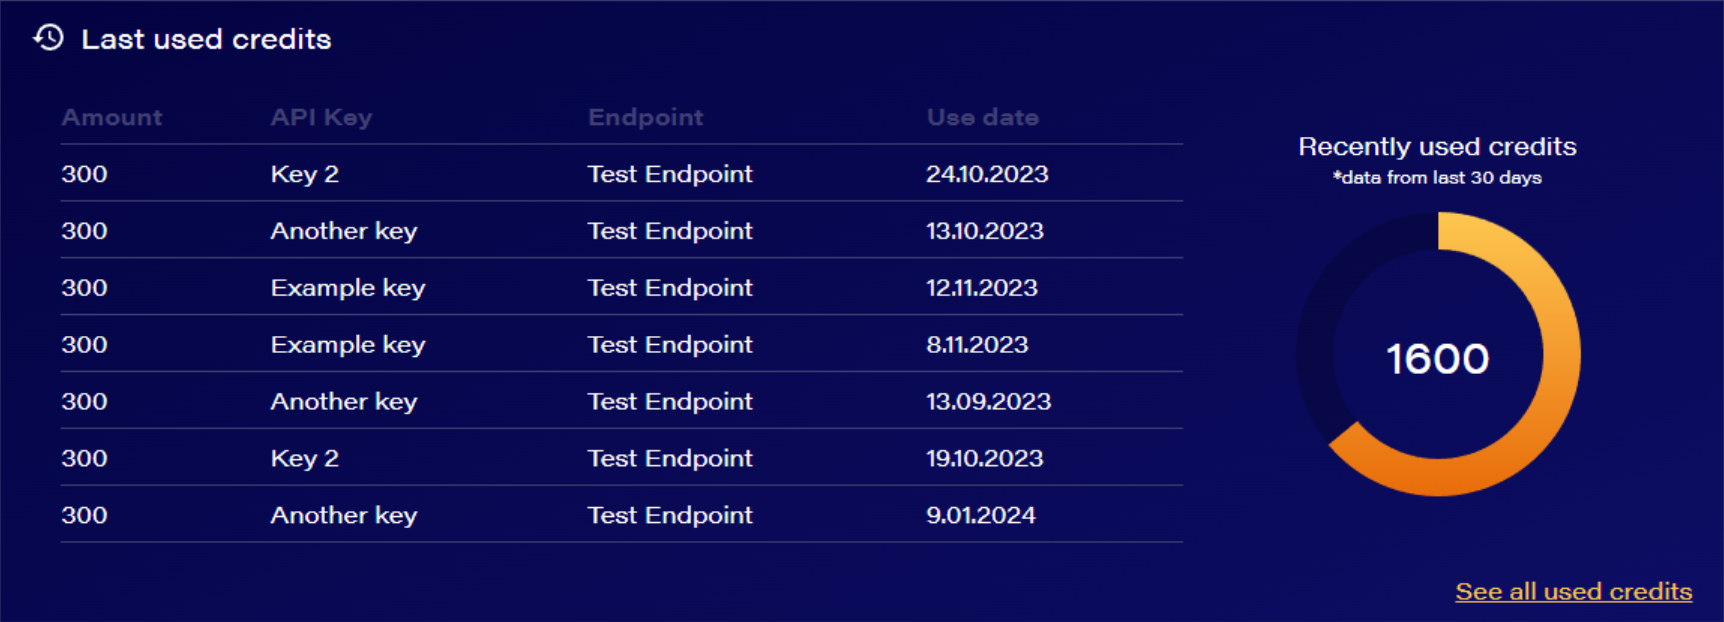
The last section displays information similar to the previous one but in regards to used credits. You can see a few last transactions as well as the number of used credits in the last 30 days. Here you can also navigate to a tab dedicated to used credits by pressing “See all used credits”.
Gained
In the “Gained” tab you can see details about all gained credits, their amount, source and expiration date.
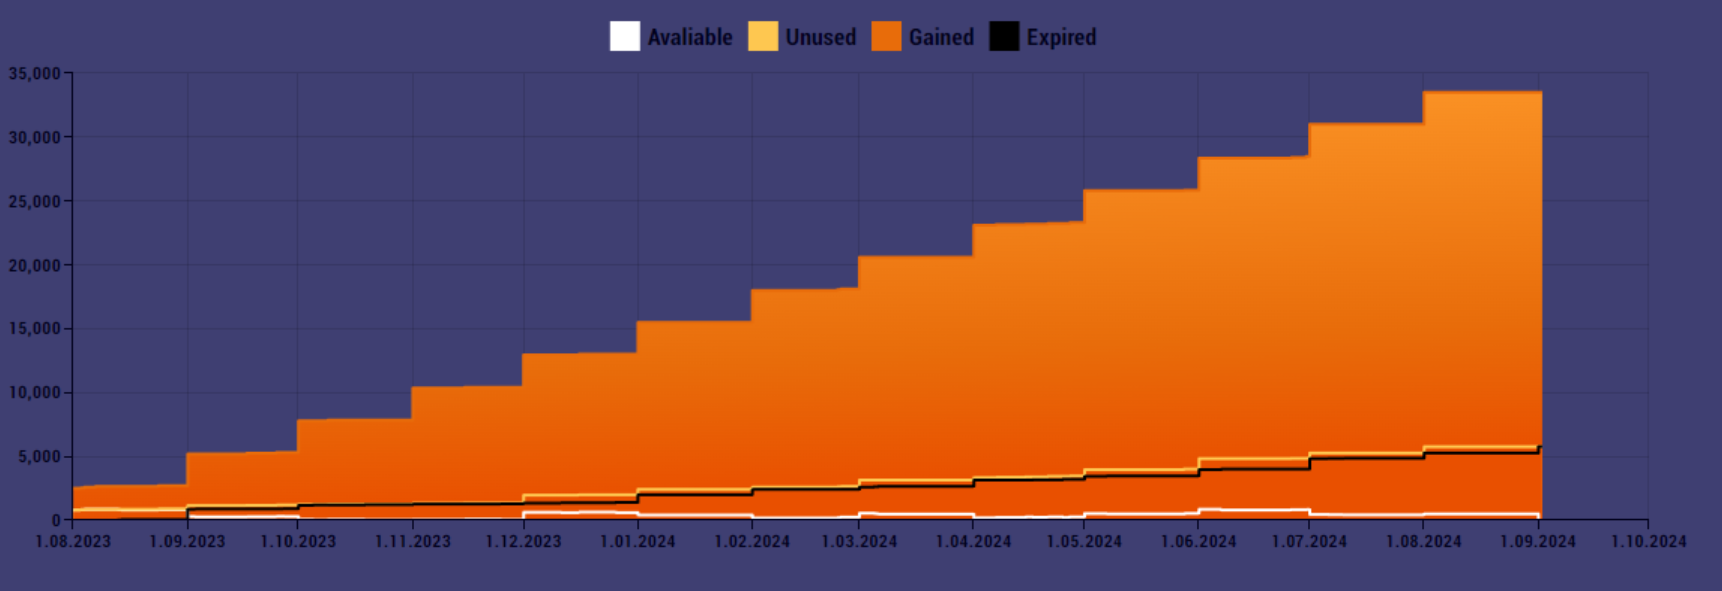
In the first section you will see a graph detailing all gained credits as well as a number of unused credits and expired credits to allow you an easier analysis of how many credits end up being wasted.
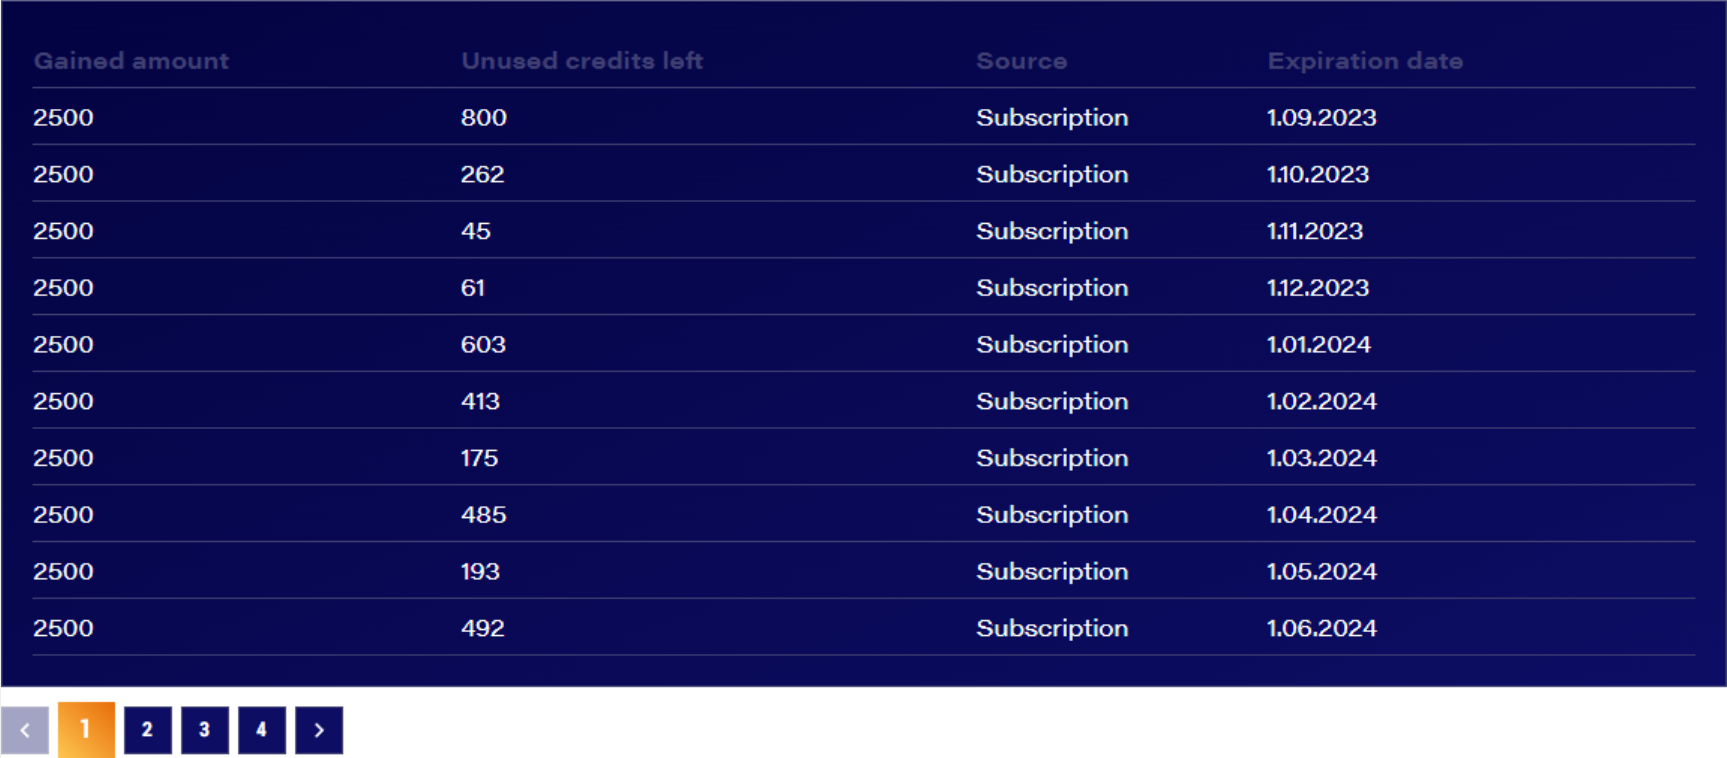
The second section displays all gained credits along with how many of them are or were unused, their source and an expiration date.
Used
In the “Used” tab you can see a detailed view of all used credits as well as group and filter this data.
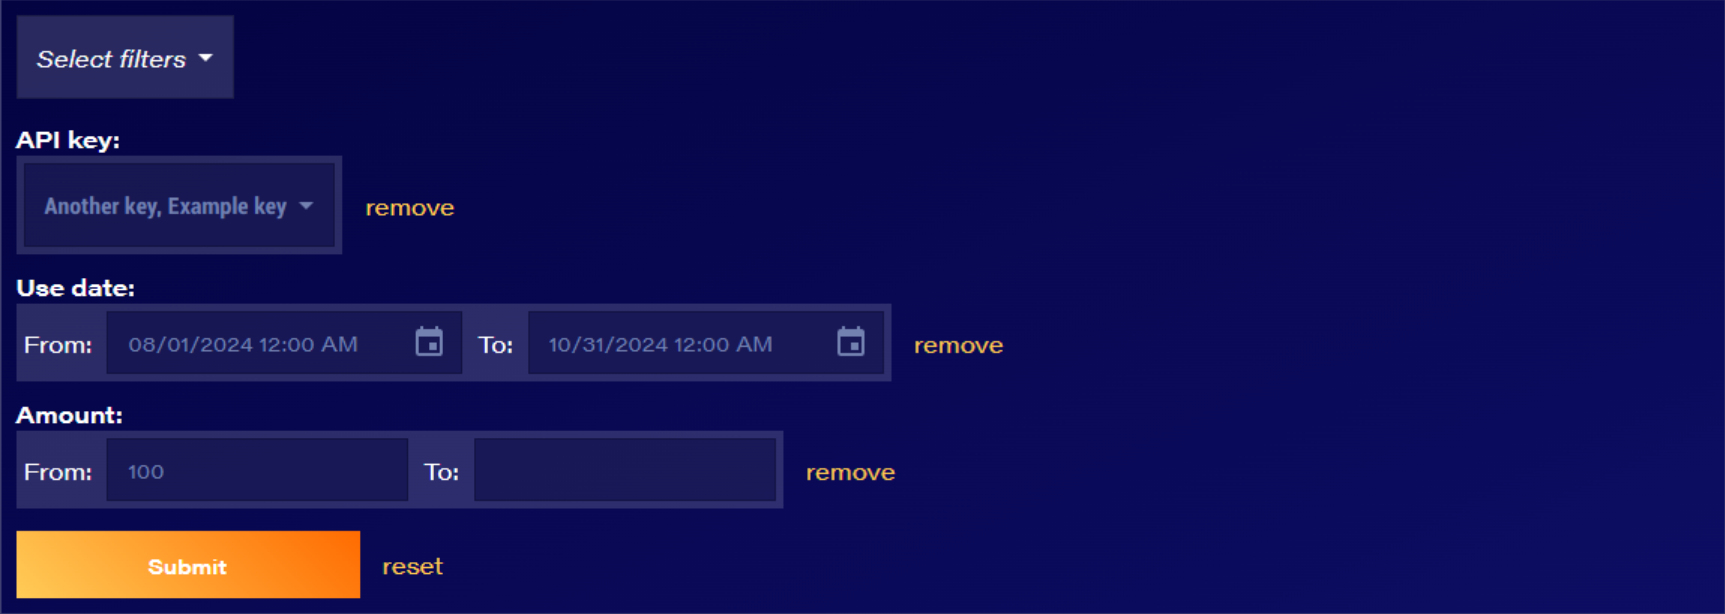
The first section allows you to filter data displayed in other sections by selecting needed filters and providing information. In the base state all used credits will be displayed, you can return to this base state at any time by clicking on the “reset” at the bottom of the first section.
The second section displays a graph detailing your use of credits with applied filters from the first section, it also has some additional options.

The first two options above the graph labeled “Single” and “Total” allow you to switch between a bar chart and an area chart.
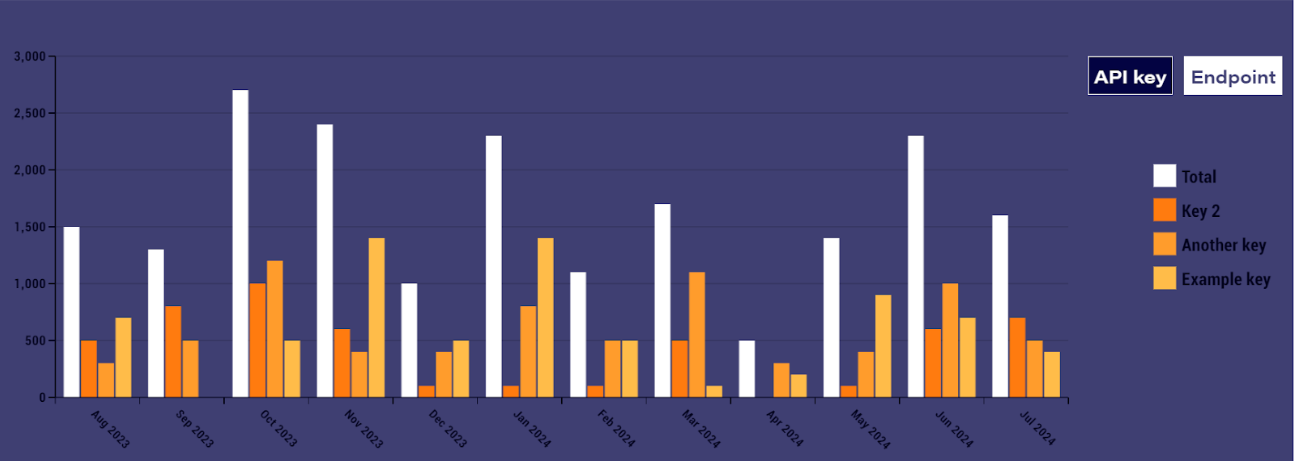
Selecting the “Single” option displays a bar chart with used points grouped into selected time intervals. Hovering over data grouped into a time interval displays detailed numbers. You can also click it to set this timeframe as a filter in the first section.

You can change the time intervals by selecting one of the options located below the graph type options. Note that some of the time interval options may be grayed out, that will indicate too much data to display correctly in these intervals.
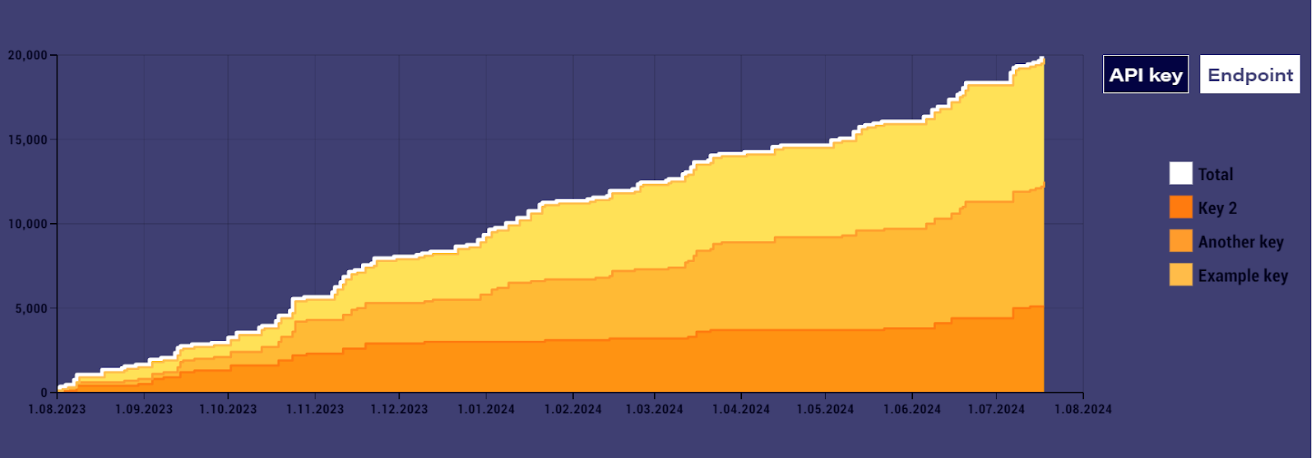
Selecting the “Total” option displays an area chart with every instance of credit use individually. Hovering over the data displays detailed numbers.
Additionally both options allow to switch grouping of the data between API keys and Endpoints by selecting the desired grouping from the options to the right of the chart
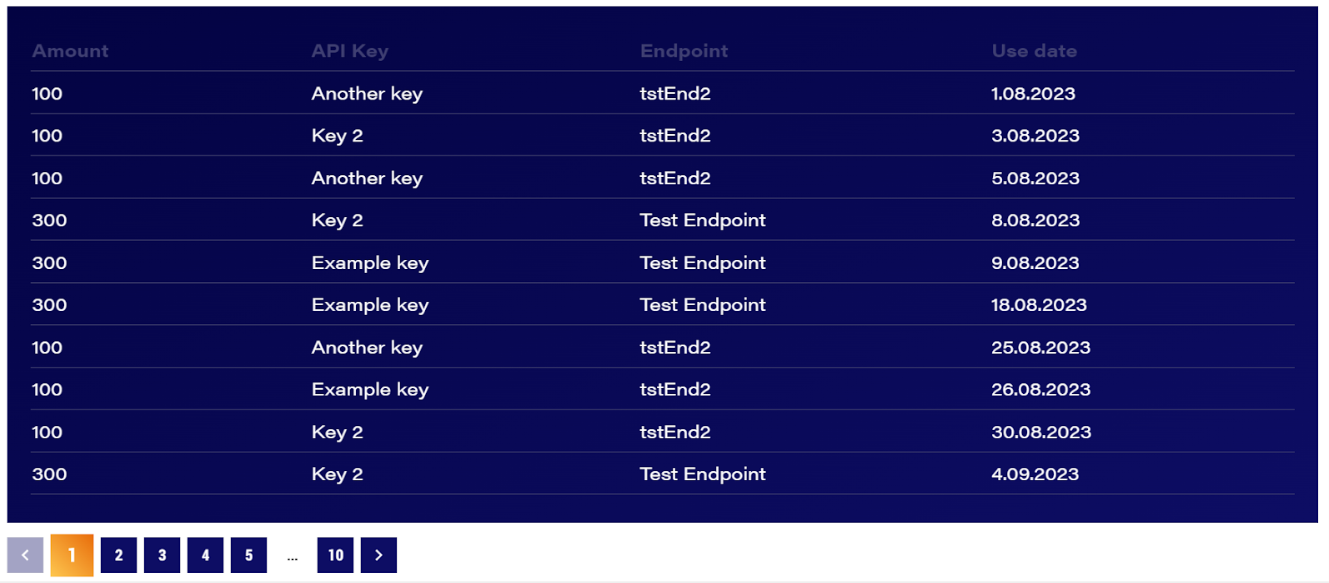
The last section displays every use of credits in the form of a table, data displayed in this section similarly to the second section is affected by the filters in the first section.